2025 Seattle general election ballot return statistics
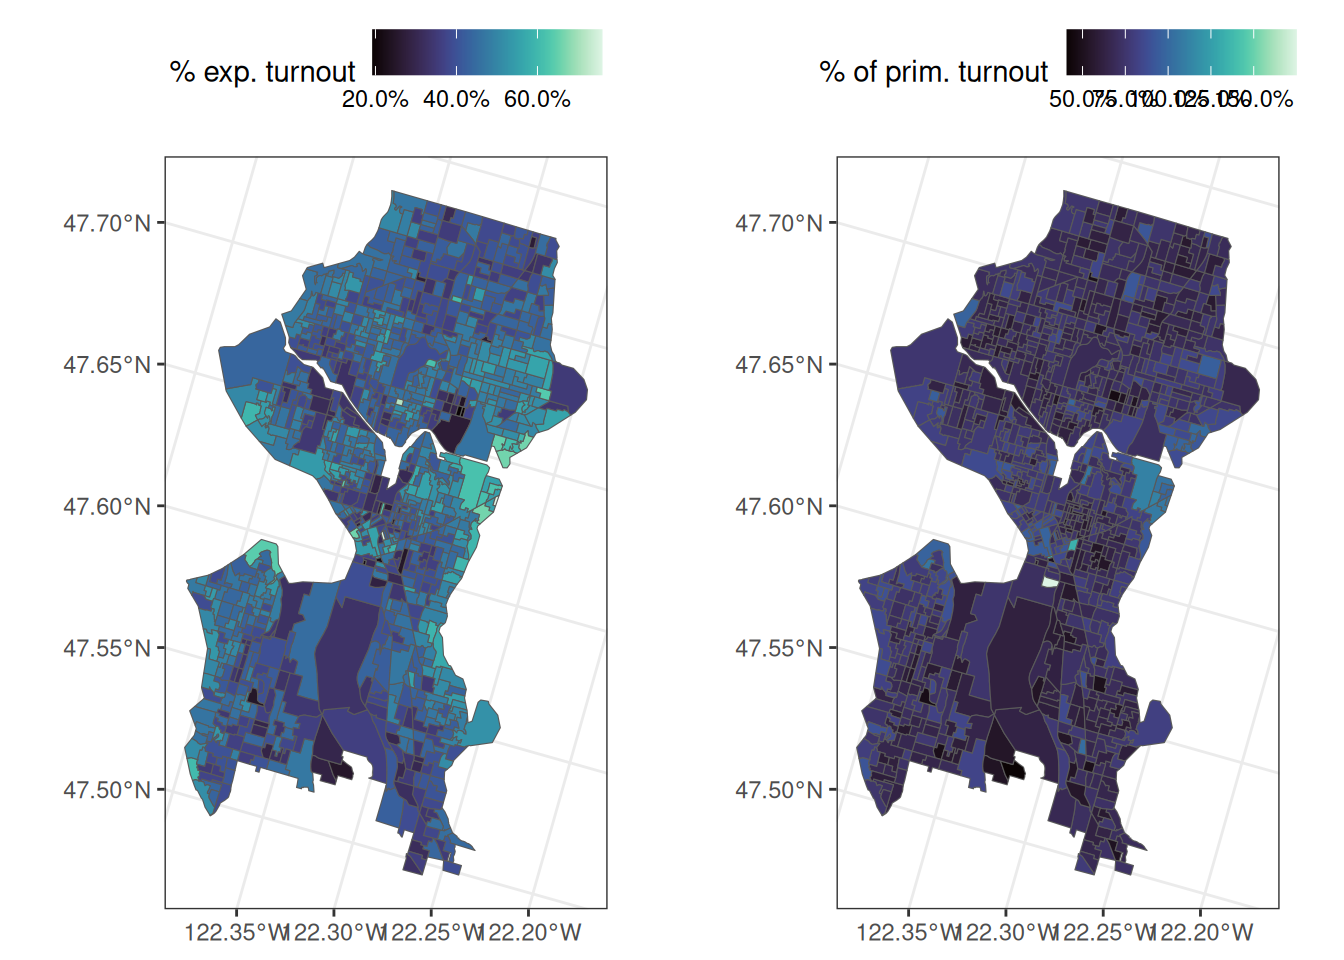
Map of absolute turnout and turnout relative to projected turnout through 2025-11-04.
Top ten precincts with higher than expected turnout:
| Precinct | Turnout | % of expected turnout | % Wilson in primary |
|---|---|---|---|
| SEA 43-1818 | 0.58 | 0.76 | 0.17 |
| SEA 43-1788 | 0.55 | 0.76 | 0.28 |
| SEA 43-3951 | 0.49 | 0.71 | 0.37 |
| SEA 43-1819 | 0.46 | 0.66 | 0.14 |
| SEA 43-1971 | 0.46 | 0.66 | 0.08 |
| SEA 43-1977 | 0.46 | 0.66 | 0.14 |
| SEA 43-1774 | 0.40 | 0.66 | 0.29 |
| SEA 43-1978 | 0.47 | 0.65 | 0.14 |
| SEA 36-1717 | 0.41 | 0.64 | 0.36 |
| SEA 34-1408 | 0.46 | 0.64 | 0.19 |
Top ten precincts with lower than expected turnout:
| Precinct | Turnout | % of expected turnout | % Wilson in primary |
|---|---|---|---|
| SEA 46-2987 | 0.03 | 0.19 | 0.65 |
| SEA 46-2081 | 0.04 | 0.20 | 0.50 |
| SEA 34-3416 | 0.04 | 0.21 | 0.54 |
| SEA 34-3693 | 0.02 | 0.23 | 0.00 |
| SEA 46-2075 | 0.10 | 0.24 | 0.50 |
| SEA 37-3573 | 0.09 | 0.25 | 0.68 |
| SEA 34-3632 | 0.12 | 0.25 | 0.46 |
| SEA 34-1550 | 0.11 | 0.25 | 0.64 |
| SEA 43-2541 | 0.11 | 0.25 | 0.87 |
| SEA 46-2275 | 0.11 | 0.26 | 0.57 |
Explore return data yourself!
Other options
Precinct-level turnout can be examined relative to projected turnout, primary turnout, and many demographic characteristics. Demographic characteristics include average age, racial makeup, educational attainment, dominant commute mode, owner vs renter occupied, average income, average home values, and dominant languages.
Voter-level data (i.e., whether an individual ballot has been returned) can be examined relative to projected turnout likelihood, recent voting history (e.g., primary), age, and gender.